
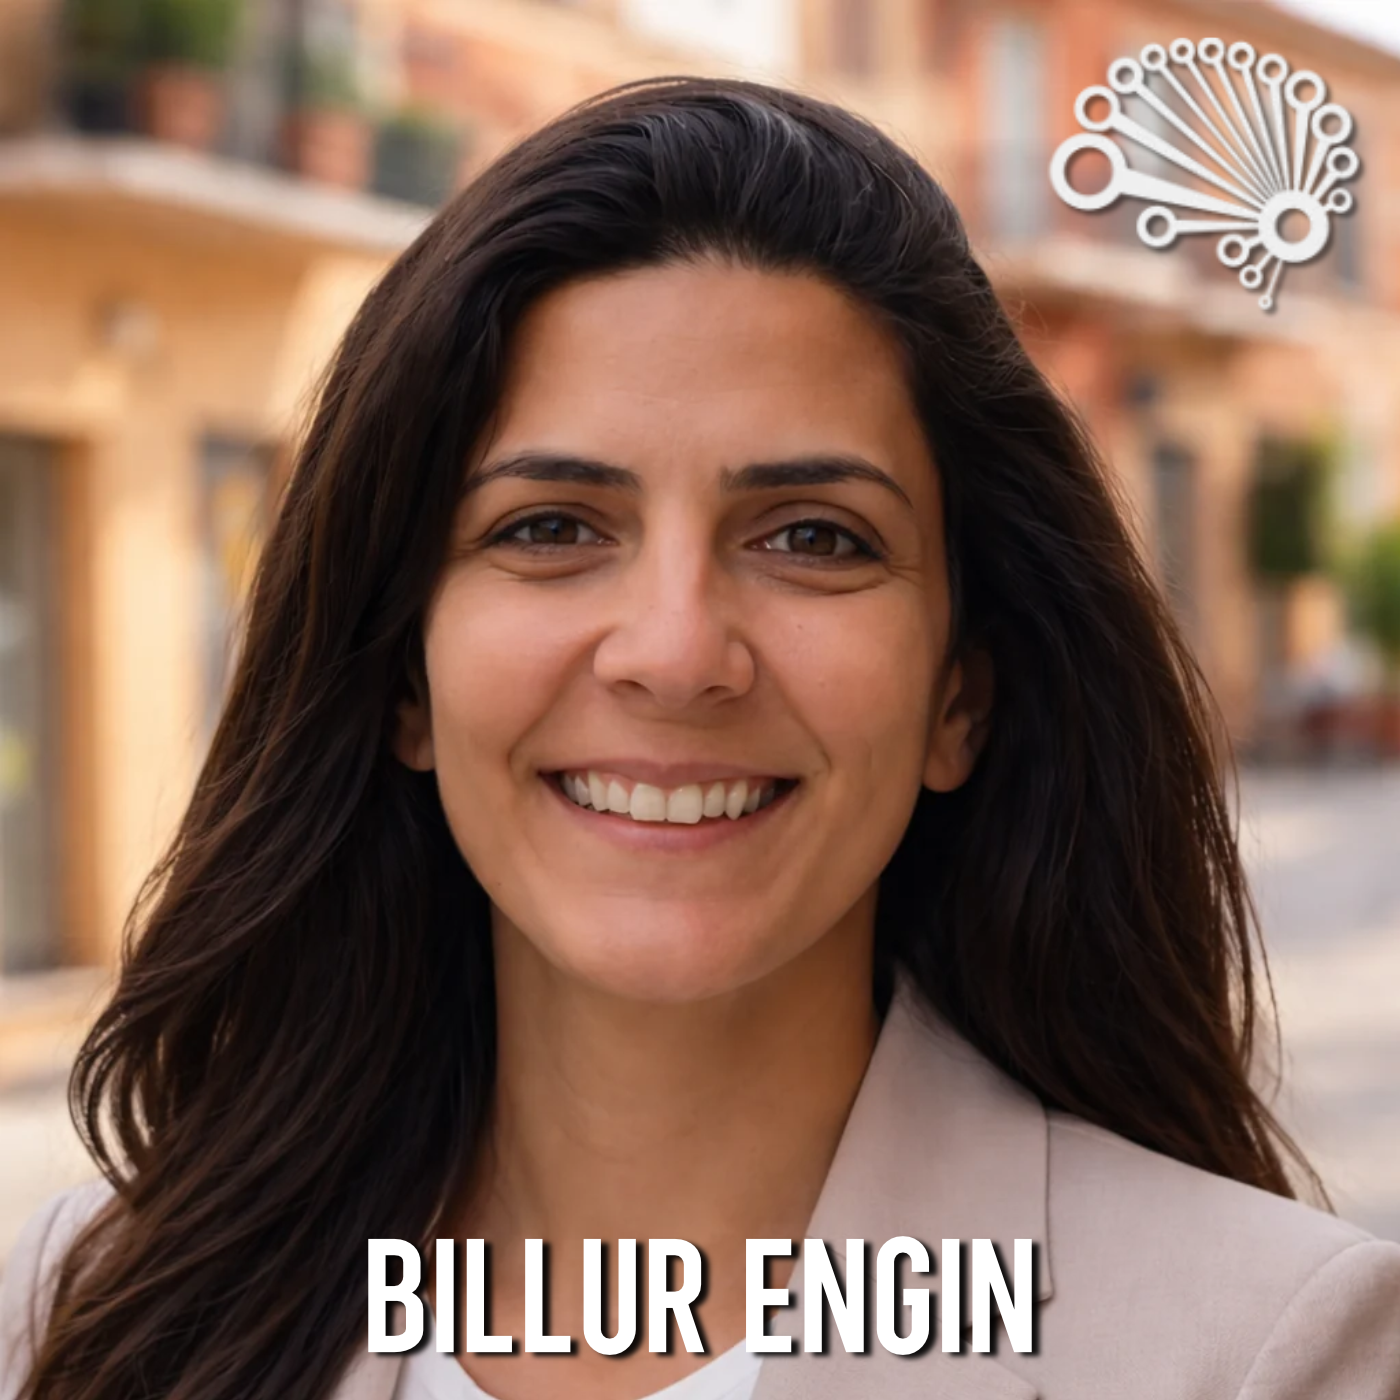
羽根を量る体重計:機能するA/Bテストの設計法(Billur Engin氏)
Super Data Science: ML & AI Podcast with Jon Krohn
要約
Prolificでデータサイエンスとアナリティクスを率いるBillur Engin氏が、Jon Krohn氏と、学びを得られる実験の設計法を語った回。A/Bテストの最大の誤解は「どのテストからも何か学べる」という思い込みで、検出できる効果量を設計時に考えないと、体重計で羽根を量るようなテストになると述べる。ランダム化できない場合の因果推論の代替手法や、予測が安価になった今こそ因果推論が重要だという見方、指標定義の統一が意思決定の信頼を支えるという考えも紹介された。
この回のポイント
- ●A/Bテスト最大の誤解は「毎回何か学べる」こと。検出力や想定効果、最小検出効果量を考えずに走らせると、時間とコストを使って何も学べない。
- ●同じ処理を二群に配信するAAテストを時々実施し、差が出れば計測システムが壊れていると判断する。結果が良すぎる場合や過去の知見と矛盾する場合も再確認を促している。
- ●予測は「いつ起きるか」を教え、因果は「なぜ起きるか」を教える。予測が安価になった今、適切な介入と実験で理由を理解する因果推論の需要が高まると述べた。
- ●対照実験ができない場合の代替として、地域単位のジオ実験、反事実予測、システムのオン・オフ切り替えの3つを挙げた。Prolificはネットワーク全体のオン・オフを多用している。
- ●予測モデルの複雑さは価値を示して初めて採用されるべきで、まず単純な予測から始めるという姿勢を示した。
- ●意思決定の基盤として、指標定義の一元化とKPIツリー、成功の定義の共有を重視。「走らせなかった実験が最もコストが高い」とも述べた。
章立て
Prolificとゲスト紹介
Prolificは、AIが偏りのない代表性ある人間データから学ぶための基盤を提供する。Billur氏の経歴とともに紹介された。
プロジェクト初週と失敗の元
開始時に指標・測定方法・必要な効果の大きさをステークホルダーと合意する重要性と、インフラの制約を考える必要性を述べた。
複雑さは価値を示すべき
予測モデルでは昨日の値が大半を説明するため、特徴量や高度な手法は追加価値を示して初めて採用すべきだという学び。
A/Bテストの誤解とAAテスト
体重計と羽根の比喩で最小検出効果量の重要性を説明し、結果を信頼できるかを確かめるAAテストを紹介した。
予測と因果、COVIDの例
予測は価値が下がり、因果理解が重要になる。COVIDで広告実験の効果が判別できなくなった経験も語られた。
実験できない場合の因果推論
ジオ実験、反事実予測、オン・オフ切り替えの3手法と、ネットワーク型市場での汚染への対処を解説した。
組織の意思決定と信頼
成功の定義の共有、指標定義の一元化、KPIツリー、AIエージェント活用のための文脈整備について語った。
推薦書と締めくくり
Pearl著『The Book of Why』を推薦。実験しないことが最大のコストという主張と採用情報、番組の総括。
解説記事
Prolificでデータサイエンスとアナリティクスを率いるBillur Engin氏が、Super Data Science Podcastに初出演し、成果の出るA/Bテストの設計法と因果推論の意義を語った。Netflixでの実験・予測の経験を踏まえた具体例が多く、実務に近い内容だ。
「羽根を量る体重計」になっていないか
Engin氏が挙げるA/Bテスト最大の誤解は、「走らせたテストからは必ず何か学べる」という思い込みである。実験は時間もコストもかかる。何を測れる設計か、検出力(power)はどの程度か、期待される効果はどれほどかを考えないまま走らせれば、何も学べないという。
これを同氏は体重計に例える。体重計で羽根は量れないが、それは体重計の故障ではなく、そもそもその効果を測るよう設計されていないだけだ。変更が小さすぎて、設定上の最小検出効果量を下回るなら、学びは得られない。Jon Krohn氏も、サイトの青色を少しだけ変えるようなテストを例に挙げて同意した。
結果を信じてよいかを見分ける
結果を信頼できるかについて、Engin氏はまず「良すぎる結果は疑う」「過去のテストから得た知見と矛盾する場合も見直す」という経験則を示した。加えて、時々AAテストを行うという。観客を二つに分け、まったく同じ処理を配信し、もし差が測定されたら計測システムのどこかがおかしい、という確認方法だ。Krohn氏はこの手法を初めて聞いたと述べている。
意外な結果の例として、休暇シーズンのマーケティング実験が語られた。業界には「利用が増える時期に広告費をかけても無駄」という通念があったが、同氏は関心の高い人が増える時期こそ適切なターゲティングで広告を出す価値があると考えた。観客を二分して広告の有無を比較したところ、テストが検出できるよう設計していた水準を大きく上回る明確な効果が見られ、理解が変わったという。
予測が安価になった今、因果が重要になる
予測が「いつ起きるか」を教えるのに対し、因果的な理解は「どのように起きるか」を教える、とEngin氏は区別する。需要の増加時期が分かれば供給側の準備はできるが、需要を何が押し上げるかを理解して初めて、プロダクトを改善し持続的な価値を生める。
そして、AIモデルの普及で予測は安価になった、と同氏は述べる。良いデータと文脈があれば、社内の誰でも十分な予測を作れる。しかし適切なデータ、介入、実験がなければ「なぜ」は分からない。Krohn氏も、LLMでモデリングの方針を素早く作れる今、人間は設計を見直して相関ではなく原因を学ぶ機会が得られる、とまとめた。
外部要因の例としてCOVIDも挙がった。Netflix時代、人気番組を使った広告の効果を測る実験を、開始の一週間前に準備していたところにCOVIDが起きた。対照群のベースラインが非常に高くなり、仮に効果があっても、COVIDの影響にかき消されてノイズと区別できなくなったという。相関だけを見れば大成功に見えたはずだと同氏は指摘する。
ランダム化できないときの3つの手段
対照実験ができない場合の代替として、同氏は次の3つを挙げた。
- ジオ実験:都市や国を単位とし、一部にだけ処理を適用して差を見る
- 反事実予測:実際に起きたことと、起こり得たことを比較する
- システムのオン・オフ切り替え:単位を「システムがオンの日」と「オフの日」にする
Prolificでは3つ目を多用している。参加者と調査をマッチングするネットワーク型のサービスでは、調査単位で処理をランダム化しても同じ参加者プールに届くため測定が汚染される。そこでネットワーク全体で処理を入れたり切ったりするという。ただしこうした準実験はシグナルを得にくく、ノイズが多いため、実施期間を慎重に考える必要があるとも述べた。
組織での意思決定と「走らせなかった実験」
組織の意思決定については、シンプルさと共通理解を重視する。Prolificでは、堅牢で誠実性の高い参加者プール、顧客の需要への対応、高品質なデータの提供という3つの成功軸を全員が理解し、自分のプロジェクトがどれを改善するのかを把握するよう求めている。
信頼が崩れる最初の要因はデータの一貫性だ。「アクティブな顧客は何人か」という質問に全員が違う答えを出すような状況は信頼を損なうとし、指標定義を一元化し、KPIツリーで各指標をつなぎ、AIエージェントで非専門家も分析できるよう文脈を整備していると語った。
また、一つだけ変えられるなら何かと問われ、「走らせなかった実験が最もコストが高い」と答えた。単純な変更でも、検証しなければ登録フローを壊すなどの静かな失敗が起こり得るからだ。
まとめ
本回の核心は、実験は「やること」より「何を検出できる設計か」が重要という点にある。事前に最小検出効果量を考え、AAテストで計測系を点検し、ランダム化が難しいときもジオ実験などで因果に迫る、という流れは、実務でそのまま使える。予測の民主化が進む中で、因果を問う力が差を生むという主張は、LLM活用が広がる日本のデータ組織にも示唆的だ。推薦書はJudea Pearl著『The Book of Why』で、観察・介入・反事実という因果の階層を学べる一冊として挙げられた。
文字起こし(英語・自動生成)
Too many of the A-B tests that we've run are never going to tell you anything. They're like bathroom scales trying to weigh a feather. Today's guest explains why and how to design experiments that actually teach you something. Welcome to another episode of the Super Data Science Podcast. I'm your host, John Krohn. Today's guest, Biller Engen leads data science and analytics at Prolific, the platform that connects AI companies and researchers with reliable, representative human participants. She previously ran experimentation forecasting work at Netflix and applied machine learning to enzyme design at DuPont. In her first ever podcast appearance, Biller explains why complexity has to earn its place in your models, why the experiment you don't run is the most costly one, and why causal inference matters more than ever now that prediction has become so cheap. Enjoy this technical episode. Biller, welcome to the Super Data Science Podcast. It's great to have you on the show. How are you doing today? Thank you, John, for the invitation. I'm really excited to be chatting with you today.
Yeah, it's your first ever podcast appearance, which is wild because you're a hugely knowledgeable, great speaker. It's an honor for us to have you on Super Data Science for your first appearance. So first off, tell us about the company that you work for, Prolific, and what you do there. The prolific is all about making sure that AI learns from the right human-generated data points. When you think about AI, it's nothing but human judgment on steroids. And if AI learns from biased data or non-representative data, then it's just going to magnify the biases on the society via the AI-led decision-making. That's why it's super important for us that AI learns from real people, reliable people, and also a representative population. We started more than a decade ago by helping academic researchers find the right audiences for their surveys, for their hypothesis. Right now, we are doing the same thing for the AI companies.
Fantastic. And so in this episode, Prolific, you guys, you specifically, have prepared me with some great topics to cover to make sure that our audience is aware of kind of the places you can get most easily tripped up with a data science project. And so we've got a great conversation ahead on data science methodology, A-B testing, causal inference, decision making at scale. And so, yeah, really appreciate you coming on and us being able to leverage your experience, prolific experience with getting measurement and experimentation right. So let's get into it. So walk us through what happens, Biller, in the first week of a new data science project before any model gets built. So we have a very cross-functional environment. And when we are starting a study, we always have a product manager, a designer, an engineering manager, as well as having targeted stakeholders within the company. So we first need to align on what it looks like before implementing anything. We need to understand what is the metric that we are trying to move, how are we going to measure it, and how much impact means a good achievement.
If we do not align on this beforehand, we won't be able to prove value even after a couple of months of work. Nice. And so it seems like the beginning of a data science project, a lot of it is about communication and understanding project requirements, that kind of thing. Exactly. So first of all, everybody needs to understand what it looks like for prolific. And most of the time, it's high quality data generation. So we need to understand which levers are we going to be pulling in order to deliver that impact. And we need to align our models to deliver aligned on results. Crystal clear. What's a mistake that you see data scientists make early in the data science methodology that ends up costing them later? Again, the reply to the previous question was that we need to communicate. A data scientist doesn't have the luxury to work in a silo. That's why even if you build the most sophisticated and most capable technology, if the business is not interested, it's not going to be a success.
The second one is making sure that the solution a data scientist is planning will be able to deliver it by the infrastructure that you have in the company because every company goes through a maturation process. And at some point, maybe the technology you're recommending will not be supported by your infrastructure. I can give you an example. We are working on improving our matching algorithms at Prolific because our objective is to find the right audience for the given studies. And our dedication to our customers is to deliver their data generation at speed. There are many ways of achieving and delivering the matching algorithm. However, the first thing we ask to our cross-functional team is do we have the right capabilities in place? For example, if we solve this problem by using embeddings, will our system be able to store it at real time? And will we be able to search very quickly, et cetera? And will this infrastructure be used by multiple different projects? Makes perfect sense.
Is there a moment in your career where changing the data science methodology completely changed the outcome of a project for you? I have a very basic answer to you, and it's one of my first learnings in the field. the complexity it needs to earn its place. I go back to my early days of building a forecast. My intuition, my first intuition, a couple of maybe decades ago, was to introduce as much data as possible, multiple dimensions of features, and also use the most complicated but cutting-edge technology to build the forecast. It turned out that what happened yesterday will predict tomorrow 90% of the time. And you just need to try and learn what other additional information do you need to make your forecast work within the remaining 10 to 15 And it takes time iterations in order to find the right signal that additional value And also you need to think about whether you need a complicated elegant but sophisticated
algorithm rather than a simple one. So we can run into trouble by using too many data. So, you know, stretching back too far, it kind of sounds like you're saying if you have huge amounts of data, you might be able to just sample from yesterday to predict what's going to happen today and you don't need to worry about the past 10 years of data that you have or whatever. And so, yeah, so being thoughtful about picking the right data to work with and also making sure that you don't make the model too complex. I'm actually thinking about different dimensions, like going back in history, most of the time is a good thing. But things change very fast. Sometimes the product that you have 10 years ago is not relevant anymore and not informative for your model. But what I was thinking is all the other dimensions that you can throw in, for example, in prolific gates, we ask hundreds of questions when we're onboarding a part system. We know a lot about them. Maybe I don't need to introduce all of these dimensions to my model when I'm making a prediction. I gotcha. I gotcha. Well, let's go from the data science methodology
in general to something that a lot of data scientists specifically end up doing in their jobs today, which is A-B testing, running experiments. What's a common myth about A-B testing? Submit that you're going to learn something with every test that you run. Experiments are costly and time-consuming, and if you are not critically thinking about what you'll be able to measure, what are you powered to measure, and what is the expected effect, then you will spend a lot of time and money and learn nothing. I like to think about it like a bathroom scale. You won't be able to measure a feather with the bathroom scale. It's not that the scale is broken. It's just that the system is not designed to measure that effect. If you're not going to be able to make a big change, big enough to be able to measure with your setting, then you're not going to learn anything. So the first thing you need to think about is the design and the expected effects and minimum detectable effect size of your experiment. Yeah, it makes so much sense. If the change is too subtle, like changing a platform from one shade of blue to a slightly different shade of blue,
That's like the feather on the scale. You're never going to be able to measure it. So how do you know when you can trust a test result versus when you should be skeptical of it? Rule of thumb, if the results were too good to be true, most likely it's not real. Go back and check it. And then if it's contradicting everything that you have learned so far via previous tests, it's also wise to go back and check it. In general, I like running AA tests from time to time. An AA test? Wow, I've never heard of that idea. It's kind of intuitive. I can kind of guess what it is, but you should tell us. So you split your audience into two and serve the exact same treatment. And if your system is measuring a difference, there's something wrong. Yeah, exactly. AA testing. I've never heard of that, but it makes so much sense. We should definitely be doing some of that. Thank you for that tip, Biller. From speaking with you before, I understand that there's a point in your career where you had an A-B test experiment result that really surprised you. Do you want to tell us about that? So there was this common intuition in marketing that in times where people are more likely to use your product,
it's not worth spending marketing money. For example, during holiday times, people are more likely to use consumer products. But my intuition was that if people are already considering signing up or buying your product, then it's worth showing your ads to related people with good targeting and you would get more out of your marketing spend. And we have tested that. For example, over a holiday period where there were more people available and more interested people available, we split our audience into two, showed the ads to half of it and didn't show any ads to the other half. And we were able to see a static impact, which is multitudes of degrees more than what we were designing the test to measure. It was a major shift in our understanding. Really cool example there, Biller. Another thing that data scientists do a lot in addition to A-B testing is trying to figure out what the heck is actually going on.
It could be in an A-B test or, you know, lots of other kinds of scenarios. we're trying to go beyond what's correlated to what's actually causing some effect that we're seeing. So what's the difference between a model that predicts well and one that tells you what's actually causing an outcome? The main difference is predicting tells you when something is going to happen and being able to describe the system causally will enable you to understand how the outcome is happening. Let's think about sales or a perfect example. We have times when we have increased demand. Knowing when the increased demand is going to happen will help us build the right pool to fulfill the demand. But understanding what drives higher demand will help us improve our product and platform so that we can make a lasting change that delivers more value to our customers.
Why Biller is causal inference now more important than ever? Because prediction has become cheap with the adoption of more capable AI models. In our company right now, with the systems that we have built, anybody can build a good enough forecast. Because if you have really good data sets, really good contacts, it's easier to do today. However, without the right data, right interventions, right experimentation, you won't be able to understand why. So it's more than just massaging the data and making sense of it. It actually targeted changes and interventions that going to help you understand the why That why causality is more in demand today Makes so much sense You know today as you say it so easy to get data and we can be using LLMs to come up with a modeling approach for us very rapidly. And so this gives us an opportunity now as humans to be taking a step back and thinking, okay, you know, what is missing here? What could I be changing about the design to actually be learning what's causing some effect
as opposed to just having some correlation. So, you know, some food for thought for us there for sure. Can you share an example where something looked like a strong correlation to you, but it actually turned out to not be causal at all? This is actually going to speak to the impact of external events on your measurement capability. That was a time. This is an example from my next six times. We were getting towards launching like a federal panel for, and we were again testing marketing. Like, what's the impact of showing a very popular show on your ad versus not? And we designed the test. We are ready to launch it. It's one week away. Then COVID happened. If you were to just look at correlational data of what happened with this ad launch, you could just say that. It was a magnificent success. Because you would be able to see a bump no matter what. But when you have a control, you have an understanding of the baseline. and the baseline is so high that what we learned is even if there's an impact, it's dwarfed by what's happening from COVID and it could very well be noise.
So we cannot rule out the correlation possibility of using that kind of ads and we couldn't learn anything. Yeah, it seems like that kind of ties back to the conversation we were having earlier talking about data science methodology where you can end up in situations at a company like Netflix, you can have so many data points to work with. that it might not make sense to stretch back as far as possible. And something like COVID happening, you've got to be mindful. Are we looking at pre-COVID data and post-COVID data and mixing those together and not factoring in something as major as the behavioral changes associated with everyone suddenly being at home all day? Yeah, great example there. So when you can't run a controlled experiment, which a lot of us as data scientists can, A lot of us as data scientists, we're just working with whatever data have already been collected. When we can't run a controlled experiment, how do you still try to get at causality? So you just need to try the next best thing. I can think of three applications.
One of them is geo-experimentation, where you are using different cities or countries as your test units. So you launch your treatment in a subset of the countries that you are serving on, and you don't in the other, and you look at the difference. Another way is to do a simple counterfactual prediction and comparing what has actually happened versus what could have happened and having a proxy. The third one, which we default to a lot at Prolific, is switching on and off your system in order to get a signal. And then your unit becomes the days you have the system on versus off. So at Prolific, we have a network. We are trying to map studies to participants. And even if you randomize studies with certain treatments, let's say we are trying a pressing recommendation, you will be still reaching out to the same pool and it's going to contaminate your measurement.
That's why we turn on and off the treatment as a network as a whole. This episode is brought to you by GiveDirectly, a nonprofit that lets you send money straight to the world's poorest people, no strings attached. What's your bar for believing a result? Randomized trials, replication, long follow-up, no strings cash has been through all three in hundreds of studies, and families keep earning more, eating better, and keeping their kids in school. One study in particular jumped out at me. In Kenya, economists found giving cash cut infant mortality in half because pregnant moms could do less hard labor and make more doctor's appointments. And GiveDirectly is upfront about what cash can't do. It won't, for example, build roads or fix schools. Donating cash directly is a concept I've been following for a long time. But if GiveDirectly is new to you, don't donate yet. Read the research first at GiveDirectly.org slash super and see if it suits you. That's GiveDirectly.org slash super. Nice. It sounds like that does kind of give you some experimental data to work with.
You know, it does kind of give you, yeah, that sounds kind of like the third situation you described. It sounds like the ideal situation because you're actually, you're kind of creating two different groups, a control group and an experimental group. Well, it's really hard to get signal with these treatments, with these quasi-experiments. It will be more noisy and you would need to consider how long you should run them. Great tip. So let's now tie together everything into the business impact that this can make. So whether we're talking about our data science methodology, A-B testing, causal inference, how can we use all these together to make good decision making within an organization, particularly if we're in a large organization with tons of data flowing around? I'm a big fan of keeping things simple and understandable. I think what good decision-making looks like in a company is everybody has a good understanding of what success looks like.
At Prolific, it is having a solid, high-integrity participant pool, being able to fulfill the demand of our customers, and also delivering high-quality outcomes, high-quality data points. Everybody needs to understand which of these three things they are improving with their projects and they need to understand the levers that are available to them so that we can have the right conversations. In the absence of this simple understanding and alignment people will spend a lot of time talking about what really matters rather than trying to improve the success dimensions that everybody aligned on You work with a lot of data, a lot of different companies. You must see examples or there must be some kind of general trends around what tends to break down when a company tries to scale data-driven decisions across many teams. The first thing that breaks trust is reliability of the data points, consistency of the data points.
There needs to be fidelity of the metric definitions. For example, if you are going into a meeting asking about how many active customers do we have, how many active participants do we have, and everybody has a different answer, that's failure and that's fast break of the trust. People shouldn't be spending time discussing what's the actual true data point. They should be spending time on how to make things better. So we have spent all of time making sure that we have solid data infrastructure, solid metric definitions centralized with the right context so that with the enablement of AI agents, anybody in the company can come in, ask simple questions, do their own analysis in a way that any other data analyst would be delivering outcomes. because if the definitions are clear, if the context is improving and kept sharp all the time, right now it's very plausible. So it sounds like a key thing is having trust in the data
and one team, you might have different data analysis teams or you might even have non-technical users working with data. That's a very common thing these days. And so how do you actually, it sounds like trust is key, like having one team trust data from another team or how do you actually build that trust across an organization so people act on the data instead of ignoring it? So this ties to two things that we have been talking about, understanding at the top level what success looks like and then building the levers and KPI trees in order to make sure that every definition is connected to each other in hierarchical and the definitions are coming from one central place. having really good data infrastructure, all the metrics tying up to each other so that you can diagnose when something is not working properly. Brilliant. Great guidance as you've had throughout this entire episode, Biller. My last technical question for you here is if you could change one thing about how companies use data to make decisions, what would that be?
In places where you can experiment, I would prefer having less assumptions, more experimentation, because in my belief, the experiment that you didn't run is the most costly. For example, you can launch a very simple change to your website and you may be breaking up your sign-up flow. And you can have these silent failures if you're not testing. Yeah, that's kind of the gold standard if we can do it, is to actually run the experiment. So, yeah, take the time, if you can, listener, to set one up and actually get that real experimental data. So, Biller, it's been great chatting with you today, and we might have listeners out there who would be excited to work with you at Prolific. Are you doing any hiring? Yes, we are hiring data scientists and applied scientists, both in UK, Europe, and US. So, take a look at our hiring ads on our website, prolific.com. And also, keep watching because we will have new label hiring.
Perfect. Thank you for that. I'm sure we have lots of listeners. You know, each of those roles, we should have thousands of listeners who would be interested with that kind of opportunity. So thank you so much, Biller. Before I let my guests go, I always ask for a book recommendation. Do you have anything for us? So I really like the book of why from Pearl. It does an amazing job simply explaining, you know, the causality letter with seeing. and then doing and then imagining. So seeing is the correlational step. Doing is the intervention, the causal experiments. And imagining is capturing the counterfactual. It's very simple written. It just, you know, helps you build that intuitive thinking. Biller, The Book of Why must be one of the most recommended books on the show. People love it. Yeah, so it's a great one to check out for sure. and yeah how should people follow you or follow prolific after this episode you can follow me
through linkedin biller engen um and you you should you can uh follow us from prolific.com love it thank you so much for taking the time with us biller really enjoyed this conversation and hope to have you on the show again thank you so much for your time really enjoyed chatting with you take care well that was a super data science episode wasn't it today in it Biller Engen detailed her bathroom scale analogy for A-B testing that a scale can't detect a feather and an experiment can detect an effect smaller than its minimum detectable effect size. She filled me in for the first time on AA tests where you split your audience and serve both halves the identical treatment. So any difference you measure means your measurement system is broken. And she talked about three fallbacks when you can't randomize geo experiments, counterfactual predictions and switching a system on and off network wide, which prolific does to keep its marketplace from contaminating results. I hope you enjoyed this data science conversation today. To be sure not to miss any of our exciting upcoming episodes, subscribe to this podcast. But
most importantly, I hope you'll just keep on listening. Until next time, keep on rocking it out there. And I'm looking forward to enjoying another round of the super data science podcast with you very soon. Thank you.
番組の概要欄(原文)
In Episode #1046, Billur Engin (who leads data science and analytics at Prolific) joins Jon Krohn to explain how to design experiments that actually teach you something. Too many A/B tests, she says, are like bathroom scales trying to weigh a feather the effect is real, but the system was never built to detect it. In her first-ever podcast appearance, Billur walks through why complexity has to earn its place in your models, the biggest myth about A/B testing, the AA test she runs to catch broken measurement, three ways to get at causality when you can’t run a controlled experiment, and why causal inference matters more than ever now that prediction has become cheap. Interested in sponsoring a SuperDataScience Podcast episode? Email natalie@superdatascience.com for sponsorship information. In this episode you will learn: (01:18) What Prolific does and why representative data matters (05:19) Why complexity has to earn its place (07:29) The biggest myth about A/B testing (11:34) Why causal inference matters more than ever (14:39) Getting at causality when you can’t run an experiment
出典・この記事について
- 番組
- Super Data Science: ML & AI Podcast with Jon Krohn(Jon Krohn)
- 元の回
- 1046: Weighing a Feather: How to Design A/B Tests That Work, with Billur Engin
- 配信日
- 要約作成日
- 公式サイト
- www.superdatascience.com/podcast
この要約・解説記事は、元の音声を文字起こしした内容をもとに AI(Claude)が日本語で作成したものです。 固有名詞や数値に誤りを含む場合があるため、正確な内容は元の音声でご確認ください。制作方法について
関連エピソード

AIチップはどう作られるのか:Merck KGaA(ダルムシュタット)のベンジャミン・ハイン氏に聞く
Super Data Science: ML & AI Podcast with Jon Krohn

個人内効果と個人間効果の分離:トロイの木馬とトファーキー
Quantitude

ICYMI 2026年10月号:AIへの恐れから、AIが可能にする仕事へ
Super Data Science: ML & AI Podcast with Jon Krohn

AIで実現する精密栄養学:Viome の Dr. Guru Banavar が語る RNA とマイクロバイオーム
Super Data Science: ML & AI Podcast with Jon Krohn

AIがゲーム開発者を罰している:Steamの「AI開示」と売上の関係(第319回)
Data Science at Home

エージェントネイティブなアプリストアを作る:Salesforce の Tyler Carlson が語る AgentExchange とヘッドレス戦略
Super Data Science: ML & AI Podcast with Jon Krohn